Executive Summary
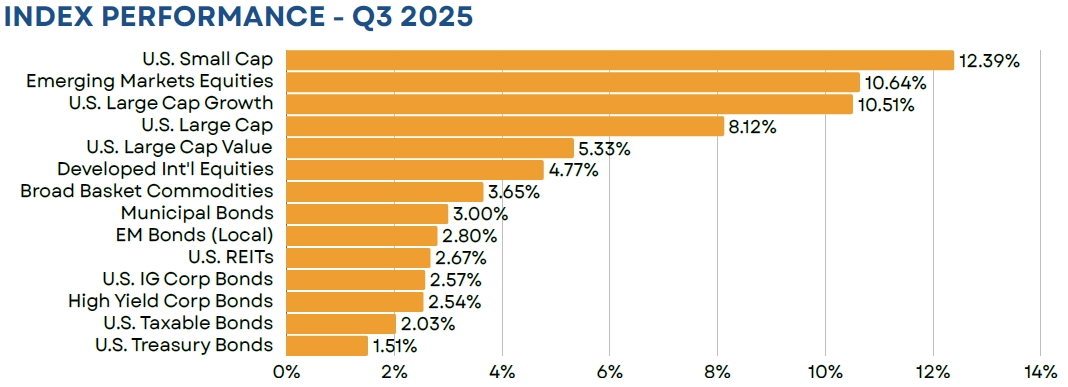
Equity markets moved higher in Q3, continuing to feed off the momentum of Q2’s post-Liberation Day rally. U.S. large caps ended the quarter higher by more than 8%, while small caps gained more than 12% and are now positive for the year. International markets also performed well, with emerging markets stocks gaining more than 10% and developed non-U.S. stocks gaining 4.77% in dollar terms. Signs of weakness in the labor market sent yields lower across the yield curve, which continued to support fixed income markets. This resulted in a 2% quarterly gain for the Bloomberg Aggregate Bond index, which is now higher by 6% on a YTD basis.
Equity
Stocks marched higher in Q3, buoyed by a strong earnings season and a resurgence in the AI trade. This sent the S&P 500 higher by 8.12% on the quarter. Leadership, however, continued to be narrow, with just six mega cap tech names accounting for more than 70% of the index’s total return. From a cap perspective, investors saw a meaningful turnaround in small cap names. The Russell 2000 index gained more than 12% on rising optimism around the potential for future rate cuts. While this still lags the S&P 500 on a YTD basis (+10.93% vs. +14.83%), it markets a notable improvement, given the index entered the quarter in negative territory for the year.
Non-U.S. stocks notched another strong quarter of gains, with major non-U.S. developed and emerging markets indexes still outpacing U.S. large caps by a wide margin for the year. Developed equities benefitted from strong performance out of Europe and Japan. European financials performed particularly well, coming off of a strong Q2 earnings season. Emerging markets stocks were boosted by strong performance out of China, as continued progress on trade talks sent the MSCI China index higher by more than 20%.
Fixed Income
U.S. investment grade bonds experienced another quarter, posting a 2.03% return in Q3. Returns were largely fueled by a steepening of the yield curve, which saw rates fall across all maturities, but disproportionately at the short end. This was driven by an uptick in rate cut expectations due to signs of weakness in the labor market, while investors still wrestled with the Fed’s ability to return inflation to their 2% target over the long term. In terms of the shape of the yield curve, the spread between the 10- and 2-year notes ended the quarter at 54 bps. This is still below the long-term average of roughly 85 bps, but a notable normalization from the depths our recent inversion in 2023 (-108 bps).
Outside of the U.S., emerging markets bonds continued to lead, gaining 2.80% in Q3. On a YTD-basis the asset class is now higher by more than 15%, which not only outpaces the 6.13% return of the Bloomberg Aggregate Bond index, but it also leads the S&P 500’s 14.83% gain. From an attribution standpoint, return sources for the asset class have been diverse, with income accounting for nearly 5% of this year’s gain, currency appreciation contributing nearly 7%, while price appreciation (i.e. rates declining) made up the remainder.
Real Assets
Commodities underperformed global equities during the quarter but still posted a modest gain of 3.65%. Performance across the commodity complex continued to be mixed. Gold prices rose by an additional 16%, on lower interest rates and fiscal concerns within the U.S., while natural gas prices sunk by 18% due to a combination of increasing supplies and weaker-than-expected demand.
Closed End Funds
In terms of total return, closed end funds had a solid quarter, gaining over 6%. However, at a universe level, discounts remained relatively stable. While not concerning, this is likely a by-product of the current environment, with the average fund trading just inside the long-term average of roughly 4.5%. That said, at an asset class level, we did see more than 100 bps of discount narrowing within municipal bonds. Municipals had been a laggard for much of the year, with the Bloomberg Municipal Bond index entering the quarter with slightly negative performance. However, we saw a clear uptick in investor appetite in Q3, which sent the benchmark Bloomberg index higher by 3% and, correspondingly, resulted in a gain of nearly 6% for the S-Network National Tax-Exempt CEF index.
iCM Tactical Strategies
iCM’s tactical strategies, which utilize ETFs and/or mutual funds, performed well on an absolute basis, but saw mixed results relative to their benchmarks. The fixed income strategy performed generally inline with its benchmark, supported by our position in emerging markets local bonds, while the equity strategy faced headwinds from an overweight to value within the U.S. and an out-of-benchmark position in commodities.
Disclosures
Integrated Capital Management, Inc. is an SEC Registered Investment Advisor. Registration does not imply any certain level of skill or training. Monthly “Market Flash” is intended solely to report on various investment views held by Integrated Capital Management. Opinions, estimates, forecasts, and statements of financial market trends that are based on current market conditions constitute our judgment and are subject to change without notice. We believe the information provided here is reliable but should not be assumed to be accurate or complete. References to specific securities, asset classes and financial markets are for illustrative purposes only and do not constitute a solicitation, offer or recommendation to purchase or sell a security.
Past performance is no guarantee of future results. Please note that investments in foreign markets are subject to special currency, political, and economic risks. Index performance returns do not reflect any management fees, transaction costs or expenses. Indexes are unmanaged and one cannot invest directly in an index.
Asset Allocation Outlook is intended solely to report on various investment views held by Integrated Capital Management. Opinions, estimates, forecasts, and statements of financial market trends that are based on current market conditions constitute our judgment and are subject to change without notice. We believe the information provided here is reliable but should not be assumed to be accurate or complete. References to specific securities, asset classes and financial markets are for illustrative purposes only and do not constitute a solicitation, offer or recommendation to purchase or sell a security. Outlook may change at any time given shifting market conditions. Past performance is no guarantee of future results. Please note that investments in foreign markets are subject to special currency, political, and economic risks. Index performance returns do not reflect any management fees, transaction costs or expenses. Indexes are unmanaged and one cannot invest directly in an index.
Closed end funds are exchange traded, may trade at a discount to their net asset values and may deploy leverage. When the strategy purchases shares of a closed-end fund at a discount to its net asset value, there can be no assurance that the discount will decrease and may possibly increase. If a closed-end fund uses leverage, increases and decreases in the value of its share price may be magnified. Distributions by a closed-end fund may include a return of capital, which would reduce the fund’s net asset value and its earnings capacity. Closed end funds are offered by prospectus. The prospectus and/or other applicable offering documents contain this and other important information about the investment strategy. You should read the prospectus and/or other applicable offering documents carefully before investing. Investors should consider the investment objectives, risks, charges and expenses of the investment strategy before investing. iCM uses third-party data that is believed to be accurate and complete. All data is subject to change.
All investing involves the assumption of risk and the possible loss of principal. The main risks as it pertains to iCM’s strategies are US equity risk, international equity and fixed-income market risk, interest rate risk and currency risk. While attempting to achieve the objectives of the strategies, investors will be exposed to the risk of loss from these sources along with others yet to be identified.
TICE Blended Benchmark comprised of 32% S&P 500/8% MSCI EAFE/38% Bloomberg Aggregate Bond/20% Bloomberg Municipal Bond/2% Cash
FTSE NAREIT All Equity REITs TR = U.S. REITs
S&P 500 Index = U.S. Large Cap
Russell 1000 Growth TR = U.S. Large Growth
Russell 1000 Value TR = U.S. Large Value
Russell 2000 Index = U.S. Small Cap
MSCI EAFE ND USD = Developed International Equities
Bloomberg High Yield Corp Bond = High Yield Bonds
Bloomberg Municipal TR = Municipal Bonds; BBgBarc
Bloomberg US Credit TR = U.S. IG Corp Bonds
Bloomberg Aggregate Bond = U.S. Taxable Bonds
Bloomberg Treasury TR = U.S. Treasury Bonds
MSCI Emerging Markets ND USD = Emerging Markets Equities;
JPM GBI EM Glbl Divers TR = EM Bonds;
Bloomberg Commodity TR USD = Broad Basket Commodities
First Trust Composite Closed-End Fund TR Index = Closed End Funds
(MMXXV-II)