Executive Summary
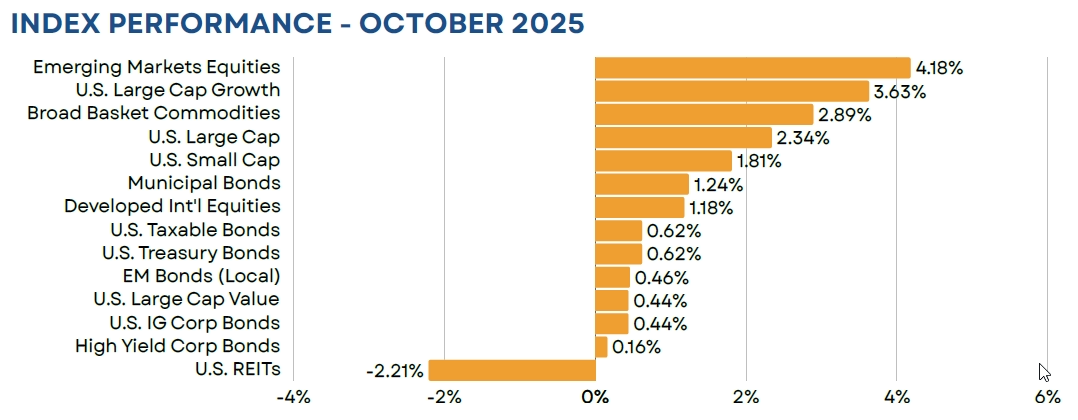
Global equity markets finished the month higher, fueled by a strong Q3 earnings season and positive progress on U.S./China trade negotiations. This left the S&P 500 higher by 2.34% in October, while developed non-U.S. stocks gained 1.18%, and emerging markets equities advanced by just over 4%. U.S. investment grade bonds notched a 0.62% return, as yields moved down slightly and credit spreads marginally widened. Commodities gained 2.89%, buoyed by a continued increase in prices for precious metals.
Equity
U.S. stocks ended October within a stone’s throw of their all-time high, now higher by 17.52% on a YTD-basis and more than 35% from their post-Liberation Day low. Markets continued to be led by large growth stocks, while leadership remained narrow. U.S. large growth stocks gained 3.63%, the large value index advanced by just 0.44%, and the Magnificent 7 rose by nearly 5%. Small caps marginally underperformed their large cap peers, gaining 1.81%. However, they have seen a strong turnaround in the last few months and are now higher by 12.39% on the year. Shares have been boosted by general strength in the U.S. economy, attractive valuations, and the prospect of lower interest rates.
Non-U.S. equity performance was mixed in October, with developed stocks trailing the U.S., while emerging markets continued to outperform. Developed market performance was largely held back by strength in the dollar. The greenback rallied by more than 2% as conflicting U.S. economic data pared back expectations for future interest rate cuts. Emerging markets, however, were generally unaffected. The MSCI EM index rose by more than 4% in both local and U.S. dollar terms. Performance was largely driven by positive developments on the trade front and strong returns from technology and AI-related stocks in Korea and Taiwan.
Fixed Income
U.S. investment grade bond markets gained 0.62% in October, pushing their YTD total return to 6.80%. The yield curve remained relatively stable on a month over month basis, as the Fed’s 25 bps rate reduction at their October meeting was largely telegraphed and already priced into markets. Credit was an underperformer on the month with investment grade bonds gaining 0.44%, while high yield returned 0.16%. This likely reflects the historically tight nature of credit spreads, which entered October at just 73 bps over treasuries for investment grade corporates and 270 bps for high yield. For reference, both are near their lowest levels in the prior 20 years and are roughly half their long-term average. From such rich levels, even minor credit concerns could lead to spread widening and potential losses for both sectors.
Real Assets
Broad-basket commodities performed well during the month, advancing by 2.89%. Performance continued to be supported by strong performance out of precious metals, with both gold and silver prices gaining more than 3.5%. Oil was a detractor, but did see a mid-month rebound as new Russian sanctions supported future purchases from China and India.
Closed End Funds
Closed end funds experienced a positive return as both equity and bond markets were higher. However, discounts did move out by 50 bps during the month, ending October with a universe average of 4.7%. This was largely driven by the taxable bond side of the market, where credit spread widening caused discounts to gap out by nearly 100 bps. That said, the average taxable bond fund still trades at an average discount of just 3.5% below NAV, which is inside the long-term average of 4%.
iCM Tactical Strategies
iCM’s tactical strategies, which utilize ETFs and/or mutual funds, performed well on an absolute basis, but generally trailed their blended benchmarks for the month. Our fixed income strategy benefitted from an underweight to corporate bonds, but our out-of-benchmark position in emerging markets local debt was a slight detractor. Our equity portfolio was supported by an allocation to emerging markets stocks and commodities, but this was offset by an overweight to value stocks and corresponding underweight to growth.
Disclosures
Integrated Capital Management, Inc. is an SEC Registered Investment Advisor. Registration does not imply any certain level of skill or training. Monthly “Market Flash” is intended solely to report on various investment views held by Integrated Capital Management. Opinions, estimates, forecasts, and statements of financial market trends that are based on current market conditions constitute our judgment and are subject to change without notice. We believe the information provided here is reliable but should not be assumed to be accurate or complete. References to specific securities, asset classes and financial markets are for illustrative purposes only and do not constitute a solicitation, offer or recommendation to purchase or sell a security.
Past performance is no guarantee of future results. Please note that investments in foreign markets are subject to special currency, political, and economic risks. Index performance returns do not reflect any management fees, transaction costs or expenses. Indexes are unmanaged and one cannot invest directly in an index.
Asset Allocation Outlook is intended solely to report on various investment views held by Integrated Capital Management. Opinions, estimates, forecasts, and statements of financial market trends that are based on current market conditions constitute our judgment and are subject to change without notice. We believe the information provided here is reliable but should not be assumed to be accurate or complete. References to specific securities, asset classes and financial markets are for illustrative purposes only and do not constitute a solicitation, offer or recommendation to purchase or sell a security. Outlook may change at any time given shifting market conditions. Past performance is no guarantee of future results. Please note that investments in foreign markets are subject to special currency, political, and economic risks. Index performance returns do not reflect any management fees, transaction costs or expenses. Indexes are unmanaged and one cannot invest directly in an index.
Closed end funds are exchange traded, may trade at a discount to their net asset values and may deploy leverage. When the strategy purchases shares of a closed-end fund at a discount to its net asset value, there can be no assurance that the discount will decrease and may possibly increase. If a closed-end fund uses leverage, increases and decreases in the value of its share price may be magnified. Distributions by a closed-end fund may include a return of capital, which would reduce the fund’s net asset value and its earnings capacity. Closed end funds are offered by prospectus. The prospectus and/or other applicable offering documents contain this and other important information about the investment strategy. You should read the prospectus and/or other applicable offering documents carefully before investing. Investors should consider the investment objectives, risks, charges and expenses of the investment strategy before investing. iCM uses third-party data that is believed to be accurate and complete. All data is subject to change.
All investing involves the assumption of risk and the possible loss of principal. The main risks as it pertains to iCM’s strategies are US equity risk, international equity and fixed-income market risk, interest rate risk and currency risk. While attempting to achieve the objectives of the strategies, investors will be exposed to the risk of loss from these sources along with others yet to be identified.
TICE Blended Benchmark comprised of 32% S&P 500/8% MSCI EAFE/38% Bloomberg Aggregate Bond/20% Bloomberg Municipal Bond/2% Cash
FTSE NAREIT All Equity REITs TR = U.S. REITs
S&P 500 Index = U.S. Large Cap
Russell 1000 Growth TR = U.S. Large Growth
Russell 1000 Value TR = U.S. Large Value
Russell 2000 Index = U.S. Small Cap
MSCI EAFE ND USD = Developed International Equities
Bloomberg High Yield Corp Bond = High Yield Bonds
Bloomberg Municipal TR = Municipal Bonds; BBgBarc
Bloomberg US Credit TR = U.S. IG Corp Bonds
Bloomberg Aggregate Bond = U.S. Taxable Bonds
Bloomberg Treasury TR = U.S. Treasury Bonds
MSCI Emerging Markets ND USD = Emerging Markets Equities;
JPM GBI EM Glbl Divers TR = EM Bonds;
Bloomberg Commodity TR USD = Broad Basket Commodities
First Trust Composite Closed-End Fund TR Index = Closed End Funds
(MMXXV-II)