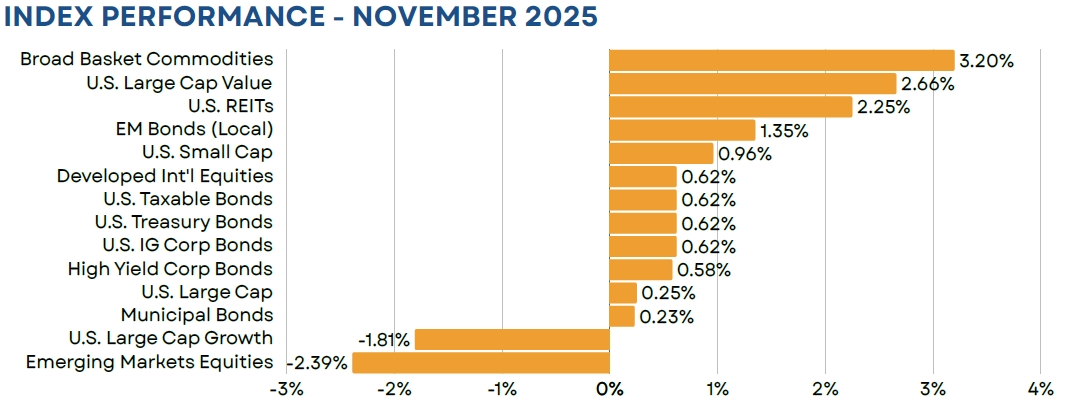
Markets cooled off a bit in November, following a near 40% run up from their mid-April lows to the their late-October highs. This came in spite of a strong earnings season and the end of the longest government shutdown in U.S. history. However, rather than focus on these positives, investors turned their attention to valuations and, more specifically, lofty valuations for AI-related technology names. This sent the Russell 1000 Growth index lower by 1.81%, its first monthly loss since March. Developed non-U.S. stocks, which tend to be less dependent on the technology sector rose during the month, while the emerging markets index was pulled lower by losses in Korea and Taiwan. Bonds, however, posted another solid month (+0.62%), as budding economic concerns pushed up the probability of a December rate cut.
Equity
After trailing by roughly 5% over the prior two months, value stocks regained leadership in November, advancing by 2.66% while their growth counterparts fell by 1.81%. That said, the loss for the growth index was fueled almost entirely by NVIDIA. The AI giant accounted for just over 13% of the Russell 1000 Growth Index and fell by more than 12.5% in November. This equated to a return contribution of -1.76%. NVIDIA’s decline was fueled by two key developments during the month. First were general concerns of lofty valuations and questionable vendor financing agreements across the AI-industry, while the other driver surrounded Google’s release of its Gemini 3 chatbot, which is viewed by many as superior to ChatGPT’s OpenAI and was developed using Google’s new high performance TPUs (Tensor Processing Units).
Developed non-U.S. stocks gained 0.62% in U.S. dollar terms, buoyed by a generally strong end to earnings season. These markets also tend to be less tech-oriented, which kept them more isolated from AI valuation concerns within the U.S. Value stocks performed exceptionally well, gaining 2.72% during the month. This pushed their YTD gain to over 36%, more than double the return for the S&P 500 (+17.81%). Emerging markets stocks, which are higher by nearly 30% on a YTD basis, took a slight step back in November (-2.39%). Similar to U.S. markets, this was attributable to a slide in mega cap tech names. Most notably, Taiwan Semiconductor, which accounts for 11% of the index, fell by 6% during the month.
Fixed Income
U.S. investment grade bonds continued to stack up gains for 2025, advancing by 0.62% in November. This brings their 2025 total return to 7.46%. Gains had been muted for much of November, but dovish Fed comments and weak economic data released near month-end sent rates lower across most of the yield curve. This also led to a dramatic shift in interest rate expectations as we look out to the Fed’s December meeting. As recently as November 19th, markets were pricing in the probability of a cut at less than 30%. That shifted to 83% as of month end. Outside of U.S. investment grade bonds, emerging markets local government bonds continued to perform exceptionally well, gaining 1.35% in November. As has been the case for much of the year, returns were driven by a combination of income and currency gains. For 2025, the asset class is now higher by 17.51%, a mere 30 bps behind the S&P 500.
Real Assets
Broad-basket commodities were a leading asset class in November, gaining 3.2%. With the exception of declining crude oil prices, most commodity complexes saw strong returns. Natural gas prices, in particular, rose more than 11% on strong demand due to a colder-than-average start to the winter heating season. Precious metals also performed well, with gold prices rising nearly 6%, ending the month at more than $4,200 per troy/oz.
Closed End Funds
Although closed end funds performed well on a NAV basis, discounts widened across all major asset classes in November. This was likely due to large fluctuations in both equity market volatility and interest rate levels, despite most equity and fixed income asset classes ending the month in positive territory (U.S. large growth and emerging markets stocks being two of the exceptions). At a universe level, discounts ended the month just outside of 5% below NAV. While these are some of the cheapest levels we have seen in 2025, the average closed end fund only appears marginally inexpensive relative to a long-term average discount of 4.7%.
iCM Tactical Strategies
iCM’s tactical strategies, which utilize ETFs and/or mutual funds, performed well on both an absolute and relative basis. Our fixed income strategy benefitted from an out-of-benchmark position in emerging markets bonds. Our equity portfolio was supported by an overweight to global value stocks, as well as our allocation to commodities.
Disclosures