Executive Summary
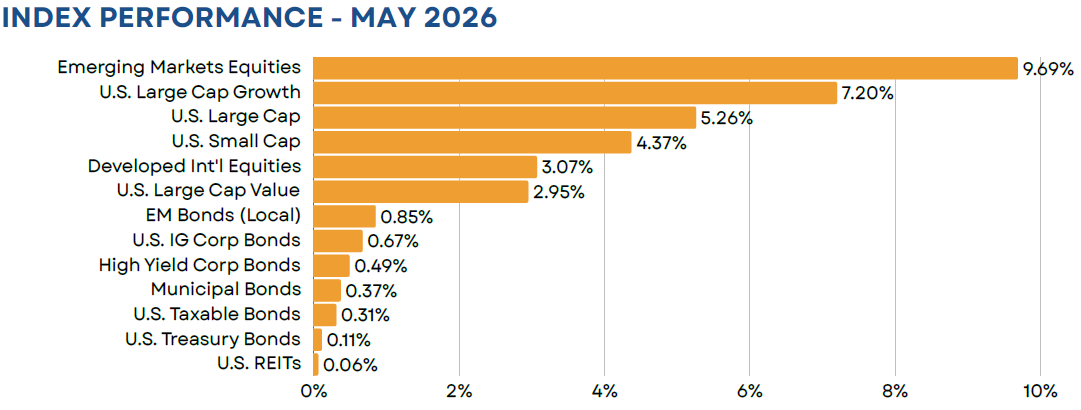
Global equity markets continued their march higher in May, buoyed by optimism around a near-term end to the U.S./Iran conflict. U.S. stocks rose by 5.26%, while developed non-U.S. stocks gained 3% and emerging markets equities soared by nearly 10%. Fixed income returns were generally muted, although positive for the month, as rates were volatile across the yield curve. Commodities were one of the few major asset classes to end the month in the red. Similar to interest rates, oil prices were highly volatile in May, peaking near $110/barrel before settling around $87/barrel at month end.
Equity
U.S. stocks were driven higher in May due to a combination of strong earnings and a resurgence in the AI trade. As of month end, 85% of companies exceeded earnings expectations, while index earnings grew at a robust 28%. Both are the strongest results that investors have seen since 2021. In terms of index performance, leadership narrowed meaningfully from earlier in the year. Just seven names accounted for 70% of the S&P 500’s total return. This included Magnificent 7 staples such as Apple, Microsoft, NVIDIA, and Tesla, as well as a handful of semiconductor names (Broadcom, AMD, and Micron), which have become the most recent beneficiaries of the AI trade.
Outside of the U.S., emerging markets were the big winner, benefitting from the same tailwinds that boosted U.S. markets. More specifically, Korean and Taiwanese tech shares soared on optimism around future demand for AI-related semiconductors and memory. Similar to the U.S., leadership was extremely narrow, with just four names (SK Hynix, Samsung, Tiawan Semi, and Mediatek) accounting for 80% of the index’s 9.69% return. On a YTD basis the MSCI EM index has now advanced by more than 25% and is higher by 54% over the last 12 months.
Fixed Income
U.S. investment grade bonds eked out a monthly return of 0.31%, despite volatility across the yield curve. Rates have now risen meaningfully since the conflict in Iran began back in March. The front end of the curve has felt pressure from rising short-term inflation expectations, while the long-end has been impacted by a rise in the term premium. That said, as markets have become more optimistic around resolution in the Middle East rates have seen some relief. The 10-year, in particular, eased by more than 20bps from its intramonth high, ending May with a yield of 4.43%.
Looking across sectors, credit was a top performer. U.S. high yield bonds gained just shy of 0.50%, as spreads fell in the latter part of the month. Emerging markets bonds also showed strong results, gaining 0.85%. While currency had a minimal impact, the asset class benefitted from its positive carry over U.S. bonds as well as overall strength in the emerging markets world.
Real Assets
Broad-basket commodities saw their first monthly decline of 2026, falling by 3.56% in May. Declines in the broad energy complex were the key detractor. A continued push toward an end to the U.S./Iran conflict sent crude oil, heating oil, and gasoline prices all tumbling in May. Moves in precious metals prices were minimal, with silver prices increasing by just under 3%, while gold prices fell by 1%. On a YTD basis, however, commodities continue to be a leading asset class (+25.03%), surpassed by only emerging markets equities (+25.61%).
Closed End Funds
Closed end funds saw another month of positive returns, although discounts were largely stable. The average fund ended the month of May with a discount of roughly 5.4%, compared to a long-term average of 4.7%. At an asset class level, discounts widened by 50 bps within taxable bonds, while narrowing by 30 bps within the municipal space. As a whole, taxable bond funds continue to trade on the cheap side of fair value. Conversely, municipals now appear slightly rich. This is a notable reversal from the market dynamics we’ve seen for much of the last few years.
iCM Strategy Performance
iCM’s Tactical strategies, which utilize ETFs and/or mutual funds, performed well on an absolute basis, but slightly trailed their benchmarks in May. Our exposure to emerging markets equities was a contributor, while our underweight to U.S. large growth created a headwind. On a YTD basis, however, all strategies remain well ahead of their benchmarks.
iCM’s Tactical Income strategies, which include TICE and TAO, also performed well on an absolute basis, but generally trailed their blended benchmarks. Our fixed income strategy performed well due to an allocation to emerging markets local bonds, however the equity strategy struggled due to an overweight to non-U.S. developed stocks.
Important Disclosures
Integrated Capital Management, Inc. is an SEC Registered Investment Advisor. Registration does not imply any certain level of skill or training. Monthly “Market Flash” is intended solely to report on various investment views held by Integrated Capital Management. Opinions, estimates, forecasts, and statements of financial market trends that are based on current market conditions constitute our judgment and are subject to change without notice. We believe the information provided here is reliable but should not be assumed to be accurate or complete. References to specific securities, asset classes and financial markets are for illustrative purposes only and do not constitute a solicitation, offer or recommendation to purchase or sell a security.
Past performance is no guarantee of future results. Please note that investments in foreign markets are subject to special currency, political, and economic risks. Index performance returns do not reflect any management fees, transaction costs or expenses. Indexes are unmanaged and one cannot invest directly in an index. Asset Allocation Outlook is intended solely to report on various investment views held by Integrated Capital Management. Opinions, estimates, forecasts, and statements of financial market trends that are based on current market conditions constitute our judgment and are subject to change without notice. We believe the information provided here is reliable but should not be assumed to be accurate or complete. References to specific securities, asset classes and financial markets are for illustrative purposes only and do not constitute a solicitation, offer or recommendation to purchase or sell a security. Outlook may change at any time given shifting market conditions. Past performance is no guarantee of future results. Please note that investments in foreign markets are subject to special currency, political, and economic risks. Index performance returns do not reflect any management fees, transaction costs or expenses. Indexes are unmanaged and one cannot invest directly in an index.
Closed end funds are exchange traded, may trade at a discount to their net asset values and may deploy leverage. When the strategy purchases shares of a closed-end fund at a discount to its net asset value, there can be no assurance that the discount will decrease and may possibly increase. If a closed-end fund uses leverage, increases and decreases in the value of its share price may be magnified. Distributions by a closed-end fund may include a return of capital, which would reduce the fund’s net asset value and its earnings capacity. Closed end funds are offered by prospectus. The prospectus and/or other applicable offering documents contain this and other important information about the investment strategy. You should read the prospectus and/or other applicable offering documents carefully before investing. Investors should consider the investment objectives, risks, charges and expenses of the investment strategy before investing. iCM uses third-party data that is believed to be accurate and complete. All data is subject to change. All investing involves the assumption of risk and the possible loss of principal. The main risks as it pertains to iCM’s strategies are US equity risk, international equity and fixed-income market risk, interest rate risk and currency risk. While attempting to achieve the objectives of the strategies, investors will be exposed to the risk of loss from these sources along with others yet to be identified.
TICE Blended Benchmark comprised of 32% S&P 500/8% MSCI EAFE/38% Bloomberg Aggregate Bond/20% Bloomberg Municipal Bond/2% Cash
iCM TICE Alpha Opportunities Benchmarks:
TAO 35/65‐Blended Index: 26.25% Russell 3000/8.75% MSCI EAFE/63% Bloomberg Aggregate Bond/2% Cash
TAO 50/50‐Blended Index: 37.5% Russell 3000/12.5% MSCI EAFE/48% Bloomberg Aggregate Bond/2% Cash
TAO 60/40‐Blended Index: 45% Russell 3000/15% MSCI EAFE/38% Bloomberg Aggregate Bond/2% Cash
TAO 80/20‐Blended Index: 60% Russell 3000/20% MSCI EAFE/18% Bloomberg Aggregate Bond/2% Cash
iCM Income Opportunities Benchmark: Blended Index: 7.50% Russell 3000/2.50% MSCI EAFE/88% Bloomberg Aggregate Bond/2% Cash
Index Definitions
FTSE NAREIT All Equity REITs TR = U.S. REITs
S&P 500 Index = U.S. Large Cap
Russell 1000 Growth TR = U.S. Large Growth
Russell 1000 Value TR = U.S. Large Value
Russell 2000 Index = U.S. Small Cap
MSCI EAFE ND USD = Developed International Equities
Bloomberg High Yield Corp Bond = High Yield Bonds
Bloomberg Municipal TR = Municipal Bonds; BBgBarc
Bloomberg US Credit TR = U.S. IG Corp Bonds
Bloomberg Aggregate Bond = U.S. Taxable Bonds
Bloomberg Treasury TR = U.S. Treasury Bonds
MSCI Emerging Markets ND USD = Emerging Markets Equities;
JPM GBI EM Glbl Divers TR = EM Bonds;
Bloomberg Commodity TR USD = Broad Basket Commodities
First Trust Composite Closed-End Fund TR Index = Closed End Funds
(MMXXVI)