Executive Summary
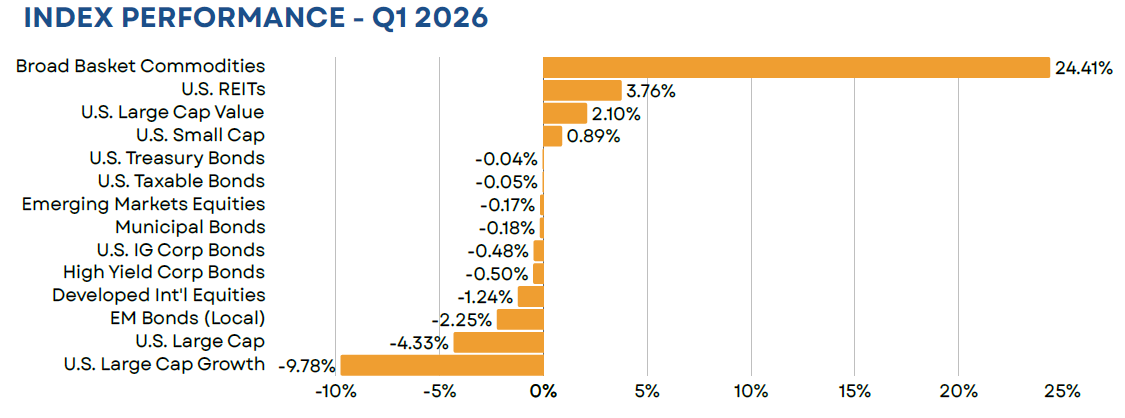
U.S. equites have gotten off to a rocky start in 2026, declining by 4.33% in Q1. The bulk of these losses were seen in March, following the commencement of U.S. military strikes in Iran. The strikes have effectively shuttered the Strait of Hormuz, a key shipping route for crude oil, liquified natural gas, and critical fertilizer inputs. This has weighed on both global equity and fixed income markets, as higher commodities prices have stoked near-term inflation concerns. Commodities have been one of the few bright spots for investors, with soaring energy prices sending the index higher by nearly 25%.
Equity
U.S. equity market declines were broad-based in March, as the VIX index rose above 30 for the first time since last year’s Liberation Day tariff announcement. However, the full quarter tells a much different story. Large value and small cap stocks finished Q1 in positive territory, while large growth stocks declined by nearly 10%. The growth index was primarily driven lower by a handful of Magnificent 7 and AI-related names, with just seven stocks accounting for 60% of its 9.78% decline. Growth stocks felt pressure earlier in the quarter, as investors questioned whether massive capital expenditure plans would translate into future profit growth. Near term performance was hampered by concerns over higher interest rates and, subsequently, higher discount rates, which disproportionately impact high-valuation stocks.
Non-U.S. markets slid in March but ended the quarter ahead of their U.S. counterparts. Asian markets across both the developed and the emerging world were the largest detractors amidst last month’s sell off, as they tend to be highly dependent on energy exports from the Middle East. The U.S. dollar also acted as a detractor, strengthening by more than 2% versus the global basket of currencies. The move was supported by a number of factors, including an apparent flight to safety, rising U.S. interest rates, and shifting energy market dynamics (i.e. crude oil is globally priced in dollars).
Fixed Income
U.S. investment grade bonds ended the quarter generally flat (-0.05%) after giving back 1.76% in March. The decline was largely fueled by rising inflation expectations and concerns that the Fed may actually decide to hike rather than cut rates in 2026. Inflation fears were on clear display within the 2-year TIPS market, where breakeven rates soared from a low of 2.29% at the start of the year to a high of 3.38% on March 20th. Fed funds futures markets also changed drastically throughout Q1. As we entered March, investors were pricing in upwards of two and a half 25 bps cuts by year end. That shifted to a 50% chance of one hike on March 26th, before ending the quarter with an expectation of no change by the December meeting
From an asset class standpoint, high yield bonds (-0.50%) and credit in general (-0.48%) were laggards on the quarter. Both equity market volatility and concerns over private credit pressured spreads upward. High yield bond spreads ended the quarter at 320 bps over treasuries, more than 70 bps above their 2026 low. That said, high yield bonds remain richly-valued with a long-term average spread to treasuries of just under 500 bps.
Real Assets
Broad-basket commodities soared in March, as the U.S./Iran conflict stressed global supply chains for key energy and agricultural products. Roughly 20% of global oil supply traveled through the Strait of Hormuz prior to its closure in March. The recent disruption has sent crude prices soaring by more than 50% in just the last month, while prices are higher by nearly 80% on a YTD-basis. Soybean oil, a key agricultural holding in the index, has also seen a massive price increase (+42% YTD). Soybean oil is a key component of biofuels, a petroleum fuel alternative. Increasing fertilizer costs are also contributing to the higher price, as the Strait of Hormuz is a key shipping route for nitrogen.
Closed End Funds
Closed end fund discounts have widened marginally thus far in 2026, moving from an average of roughly 5% below NAV on December 31st 2025 to 5.7% at quarter end. Discounts widened across most major asset classes. Increasing interest rates, higher credit spreads, and equity market volatility all pressured discounts wider. The lone exception was within municipal bonds. While discounts did move out a bit in March, they held onto some of the tightening experienced earlier in the year. Municipals ended the quarter with an average discount of 4%, well below the recent high of 8.5% that we saw in early 2025.
iCM Strategy Performance
iCM’s Tactical strategies, which utilize ETFs and/or mutual funds, performed particularly well on both an absolute and relative basis. Our fixed income strategy benefitted from an underweight to credit while our equity portfolio was supported by positions in commodities and emerging markets value, as well as an overweight to value within the U.S. This translated into positive quarterly returns for the majority of our strategies compared to losses for their benchmarks.
iCM’s Tactical Income strategies, which include TICE and TAO, outperformed their blended benchmarks. Although closed end fund discounts widened during the quarter, the TICE strategy was buoyed by strong performance from its non-U.S. equity holdings. TAO’s performance was largely supported by positions within its High Conviction Asset sleeve. In particular, emerging markets value stocks and commodities were top performing asset classes during the quarter. This led to positive absolute returns for all the TAO strategies in Q1, compared to losses for their benchmarks.
Disclosures
Integrated Capital Management, Inc. is an SEC Registered Investment Advisor. Registration does not imply any certain level of skill or training. Monthly “Market Flash” is intended solely to report on various investment views held by Integrated Capital Management. Opinions, estimates, forecasts, and statements of financial market trends that are based on current market conditions constitute our judgment and are subject to change without notice. We believe the information provided here is reliable but should not be assumed to be accurate or complete. References to specific securities, asset classes and financial markets are for illustrative purposes only and do not constitute a solicitation, offer or recommendation to purchase or sell a security.
Past performance is no guarantee of future results. Please note that investments in foreign markets are subject to special currency, political, and economic risks. Index performance returns do not reflect any management fees, transaction costs or expenses. Indexes are unmanaged and one cannot invest directly in an index.
Asset Allocation Outlook is intended solely to report on various investment views held by Integrated Capital Management. Opinions, estimates, forecasts, and statements of financial market trends that are based on current market conditions constitute our judgment and are subject to change without notice. We believe the information provided here is reliable but should not be assumed to be accurate or complete. References to specific securities, asset classes and financial markets are for illustrative purposes only and do not constitute a solicitation, offer or recommendation to purchase or sell a security. Outlook may change at any time given shifting market conditions. Past performance is no guarantee of future results. Please note that investments in foreign markets are subject to special currency, political, and economic risks. Index performance returns do not reflect any management fees, transaction costs or expenses. Indexes are unmanaged and one cannot invest directly in an index.
Closed end funds are exchange traded, may trade at a discount to their net asset values and may deploy leverage. When the strategy purchases shares of a closed-end fund at a discount to its net asset value, there can be no assurance that the discount will decrease and may possibly increase. If a closed-end fund uses leverage, increases and decreases in the value of its share price may be magnified. Distributions by a closed-end fund may include a return of capital, which would reduce the fund’s net asset value and its earnings capacity. Closed end funds are offered by prospectus. The prospectus and/or other applicable offering documents contain this and other important information about the investment strategy. You should read the prospectus and/or other applicable offering documents carefully before investing. Investors should consider the investment objectives, risks, charges and expenses of the investment strategy before investing. iCM uses third-party data that is believed to be accurate and complete. All data is subject to change.
All investing involves the assumption of risk and the possible loss of principal. The main risks as it pertains to iCM’s strategies are US equity risk, international equity and fixed-income market risk, interest rate risk and currency risk. While attempting to achieve the objectives of the strategies, investors will be exposed to the risk of loss from these sources along with others yet to be identified.