Executive Summary
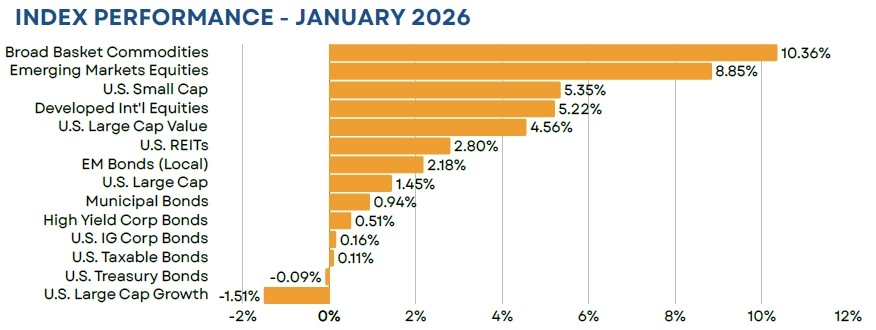
Global equity markets started off the year on solid footing despite mounting geopolitical concerns, ranging from talks of the U.S. annexing Greenland to unrest in Iran. That said, we did see performance dispersion across regions and style. Emerging markets led the way with a healthy 8.85% return (in U.S. dollar terms), while U.S. growth stocks declined by 1.51%. Bond markets ended the month with a marginal 0.11% return, as rates were driven higher mid-month due to strong U.S. economic data and a historic spike in Japanese bond yields. Commodities were a standout performer, advancing by more than 10%, as precious metals prices soared to new highs before collapsing on the last trading day of January.
Equity
Equity market performance broadened in January, with small caps (+5.35%) and value (+4.56%) leading the way within U.S. markets, while growth stocks declined (-1.51%). Microsoft alone accounted for the majority of the decline in the Russell 1000 Growth index, as concerns over increasing capital expenditures sent the stock lower by 11%. Conversely, small caps turned in their best monthly return since August of 2025. Shares were buoyed by strong U.S. economic growth and an optimistic outlook for the Q4 earnings season.
Emerging markets, however, were the standout performer, gaining 8.85% in U.S. dollar terms. Results were strong across most major regions but for vastly different reasons. Brazilian equities benefitted from their exposure to natural resources, with strong gains for both metals and energy-related commodities. Conversely, major Asian economies, such as South Korea and Taiwan, saw their technology shares boosted by AI-driven demand for memory chips.
Fixed Income
U.S. investment grade bonds started the year with marginal gains (+0.11%), as rates rose modestly across the yield curve. The short end saw pressure due to increasing estimates of U.S. economic growth, while sticky inflation led to slightly higher rates for longer dated bonds. This also resulted in a repricing of interest rate expectations, with futures markets now pricing in 2026’s first rate cut at the June meeting. Investors appeared more dovish at the start of the year, pricing in a March cut at just over 50% and at least one cut by April with a near 80% probability. Outside of the U.S., emerging markets local bonds continued to be a strong performer. The asset class gained over 2% in January, bolstered by declining rates and a broadly weaker U.S. dollar.
Real Assets
Broad-basket commodities were a top gainer in January, with a return of more than 10%. Unlike much of 2025, where precious metals were the key performance driver, strong returns were seen across most major commodity complexes. To start with precious metals, it was a near straight upward trajectory for most of the month, before prices crashed on January 30th. However, despite a one day drop of more than 25% in silver prices and a 9% drop in gold prices, both still ended the month with near double digit price gains. Energy prices also saw strong performance. Crude oil rose 14% on increasing geopolitical tensions, while natural gas prices soared nearly 40% on colder than expected weather across the U.S. and Europe.
Closed End Funds
Closed end funds saw strong returns in January, with the S-Network Composite index gaining 3.64%. Performance was supported by strong results on a NAV basis, as well as discount narrowing across the municipal bond sector. Municipal bonds benefitted from an increase in investor appetite, especially at the long end of the curve. As we entered the year, 30 year bonds traded at a near 150 bps yield advantage over 10 year bonds, their widest spread in more than a decade.
iCM Tactical Strategies
iCM’s tactical strategies, which utilize ETFs and/or mutual funds, performed well on both an absolute and relative basis. Our fixed income strategy benefitted from an out-of-benchmark position in emerging markets bonds, while our equity portfolio was supported by an overweight to non-U.S. developed and emerging markets stocks, as well as an allocation to broad-basket commodities.
Important Disclosures
Integrated Capital Management, Inc. is an SEC Registered Investment Advisor. Registration does not imply any certain level of skill or training. Monthly “Market Flash” is intended solely to report on various investment views held by Integrated Capital Management. Opinions, estimates, forecasts, and statements of financial market trends that are based on current market conditions constitute our judgment and are subject to change without notice. We believe the information provided here is reliable but should not be assumed to be accurate or complete. References to specific securities, asset classes and financial markets are for illustrative purposes only and do not constitute a solicitation, offer or recommendation to purchase or sell a security.
Past performance is no guarantee of future results. Please note that investments in foreign markets are subject to special currency, political, and economic risks. Index performance returns do not reflect any management fees, transaction costs or expenses. Indexes are unmanaged and one cannot invest directly in an index.
Asset Allocation Outlook is intended solely to report on various investment views held by Integrated Capital Management. Opinions, estimates, forecasts, and statements of financial market trends that are based on current market conditions constitute our judgment and are subject to change without notice. We believe the information provided here is reliable but should not be assumed to be accurate or complete. References to specific securities, asset classes and financial markets are for illustrative purposes only and do not constitute a solicitation, offer or recommendation to purchase or sell a security. Outlook may change at any time given shifting market conditions. Past performance is no guarantee of future results. Please note that investments in foreign markets are subject to special currency, political, and economic risks. Index performance returns do not reflect any management fees, transaction costs or expenses. Indexes are unmanaged and one cannot invest directly in an index
Closed end funds are exchange traded, may trade at a discount to their net asset values and may deploy leverage. When the strategy purchases shares of a closed-end fund at a discount to its net asset value, there can be no assurance that the discount will decrease and may possibly increase. If a closed-end fund uses leverage, increases and decreases in the value of its share price may be magnified. Distributions by a closed-end fund may include a return of capital, which would reduce the fund’s net asset value and its earnings capacity. Closed end funds are offered by prospectus. The prospectus and/or other applicable offering documents contain this and other important information about the investment strategy. You should read the prospectus and/or other applicable offering documents carefully before investing. Investors should consider the investment objectives, risks, charges and expenses of the investment strategy before investing. iCM uses third-party data that is believed to be accurate and complete. All data is subject to change.
All investing involves the assumption of risk and the possible loss of principal. The main risks as it pertains to iCM’s strategies are US equity risk, international equity and fixed-income market risk, interest rate risk and currency risk. While attempting to achieve the objectives of the strategies, investors will be exposed to the risk of loss from these sources along with others yet to be identified.
TICE Blended Benchmark comprised of 32% S&P 500/8% MSCI EAFE/38% Bloomberg Aggregate Bond/20% Bloomberg Municipal Bond/2% Cash
FTSE NAREIT All Equity REITs TR = U.S. REITs
S&P 500 Index = U.S. Large Cap
Russell 1000 Growth TR = U.S. Large Growth
Russell 1000 Value TR = U.S. Large Value
Russell 2000 Index = U.S. Small Cap
MSCI EAFE ND USD = Developed International Equities
Bloomberg High Yield Corp Bond = High Yield Bonds
Bloomberg Municipal TR = Municipal Bonds; BBg Barc
Bloomberg US Credit TR = U.S. IG Corp Bonds
Bloomberg Aggregate Bond = U.S. Taxable Bonds
Bloomberg Treasury TR = U.S. Treasury Bonds
MSCI Emerging Markets ND USD = Emerging Markets Equities;
JPM GBI EM Glbl Divers TR = EM Bonds;
Bloomberg Commodity TR USD = Broad Basket Commodities
First Trust Composite Closed-End Fund TR Index = Closed End Funds (MMXXVI)