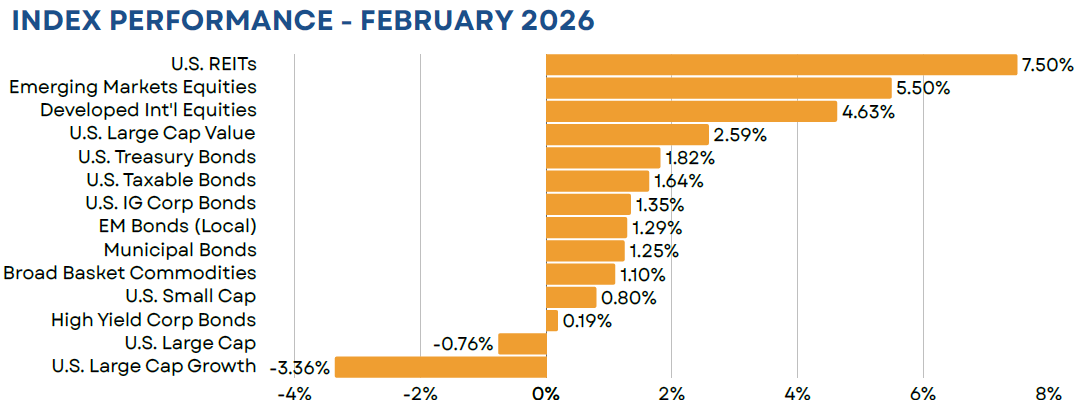
U.S. equity markets were volatile in February, with the S&P 500 posting its first monthly decline since April 2025. Markets struggled with a mixed earnings season that led to meaningful declines in a number of mega cap tech names as well as a highly anticipated Supreme Court ruling that struck down President Trump’s ability to use the International Economic Emergency Powers Act (IEEPA) to enact tariffs. Outside of the U.S., investors saw widespread gains across both developed and emerging markets. Developed markets benefitted from positive political developments in Japan, while emerging markets saw strong gains out of their technology sector. Bonds also turned in a strong month, gaining 1.64%. Treasuries rallied by 1.82%, as yields fell across the yield curve on heightened geopolitical tensions and growing AI concerns.
Equity
Equity market performance continued to broaden out in February. Although earnings reports for mega cap technology names were generally strong and above analyst estimates, investors expressed concerns around growing capital expenditure plans and the risk that these investments may not translate into increased profitability. This led growth stocks lower by more than 3% on the month, while value stocks gained 2.59%. Small caps also performed well for a second consecutive month (0.80%), buoyed by an exceptionally strong earnings season, their best since mid-2021.
Non-U.S. markets continued to boast strong returns, with the MSCI EAFE index gaining 4.63% and the MSCI EM index advancing by 5.50% (both in USD terms). Developed markets equities benefitted from strong gains out of Japan, where positive election results increased the likelihood of future fiscal stimulus. Strong performance out of Asia also propelled emerging markets stocks higher. Technology stocks, in particular, performed well, driven by optimism around future artificial intelligence investments.
Fixed Income
U.S. investment grade bonds produced a total return of 1.64% as rates fell meaningfully at the intermediate and long end of the curve. Stepping out on the credit spectrum, high yield bonds were an underperformer in February, gaining just 0.19%. Spreads remain tight today but moved out by roughly 25 bps during the month. This was largely a spillover effect, driven by growing credit concerns around the largely opaque private credit market. Outside of the U.S., emerging markets local bonds, despite lagging U.S. investment grade bonds, gained a respectable 1.29% in USD terms. This boosts the asset class’s YTD gain to 3.49%.
Real Assets
Broad-basket commodities produced their second consecutive month of positive performance, gaining 1.10%. Gains were seen across most major commodity complexes, with oil prices rising on elevated Middle East tensions, while precious metals’ prices experienced a snap back from the massive declines we saw in late January. Natural gas was the only laggard of note, with a price decline of more than 30%, as forecasts for warmer weather weighed on expected demand.
Closed End Funds
Closed end funds performed well on a NAV basis, while universe-wide discounts were generally stable. We did, however, see a bit of widening across taxable fixed income funds. This was largely due to growing concerns around risks within private credit and the slight contagion we saw in public high yield and bank loan markets. Discounts narrowed marginally across most other major asset classes.
iCM Strategies
iCM’s Tactical strategies, which utilize ETFs and/or mutual funds, performed well on both an absolute and relative basis. Our fixed income strategy benefitted from an underweight to credit while our equity portfolio was supported by an overweight to non-U.S. developed and emerging markets stocks, as well as an overweight to value within the U.S.
iCM’s Tactical Income strategies, which include TICE and TAO, outperformed their blended benchmarks. While CEF discounts were generally stable during the month, TICE did benefit from our allocation to U.S. treasuries, which performed well in February. TAO’s performance was largely supported by positions within its High Conviction Asset sleeve. In particular, long-term U.S. treasuries, non-U.S. value, and emerging markets value stocks were all top performing asset classes during the month.
Disclosures
Integrated Capital Management, Inc. is an SEC Registered Investment Advisor. Registration does not imply any certain level of skill or training. Monthly “Market Flash” is intended solely to report on various investment views held by Integrated Capital Management. Opinions, estimates, forecasts, and statements of financial market trends that are based on current market conditions constitute our judgment and are subject to change without notice. We believe the information provided here is reliable but should not be assumed to be accurate or complete. References to specific securities, asset classes and financial markets are for illustrative purposes only and do not constitute a solicitation, offer or recommendation to purchase or sell a security.
Past performance is no guarantee of future results. Please note that investments in foreign markets are subject to special currency, political, and economic risks. Index performance returns do not reflect any management fees, transaction costs or expenses. Indexes are unmanaged and one cannot invest directly in an index.
Asset Allocation Outlook is intended solely to report on various investment views held by Integrated Capital Management. Opinions, estimates, forecasts, and statements of financial market trends that are based on current market conditions constitute our judgment and are subject to change without notice. We believe the information provided here is reliable but should not be assumed to be accurate or complete. References to specific securities, asset classes and financial markets are for illustrative purposes only and do not constitute a solicitation, offer or recommendation to purchase or sell a security. Outlook may change at any time given shifting market conditions. Past performance is no guarantee of future results. Please note that investments in foreign markets are subject to special currency, political, and economic risks. Index performance returns do not reflect any management fees, transaction costs or expenses. Indexes are unmanaged and one cannot invest directly in an index.
Closed end funds are exchange traded, may trade at a discount to their net asset values and may deploy leverage. When the strategy purchases shares of a closed-end fund at a discount to its net asset value, there can be no assurance that the discount will decrease and may possibly increase. If a closed-end fund uses leverage, increases and decreases in the value of its share price may be magnified. Distributions by a closed-end fund may include a return of capital, which would reduce the fund’s net asset value and its earnings capacity. Closed end funds are offered by prospectus. The prospectus and/or other applicable offering documents contain this and other important information about the investment strategy. You should read the prospectus and/or other applicable offering documents carefully before investing. Investors should consider the investment objectives, risks, charges and expenses of the investment strategy before investing. iCM uses third-party data that is believed to be accurate and complete. All data is subject to change.
All investing involves the assumption of risk and the possible loss of principal. The main risks as it pertains to iCM’s strategies are US equity risk, international equity and fixed-income market risk, interest rate risk and currency risk. While attempting to achieve the objectives of the strategies, investors will be exposed to the risk of loss from these sources along with others yet to be identified.