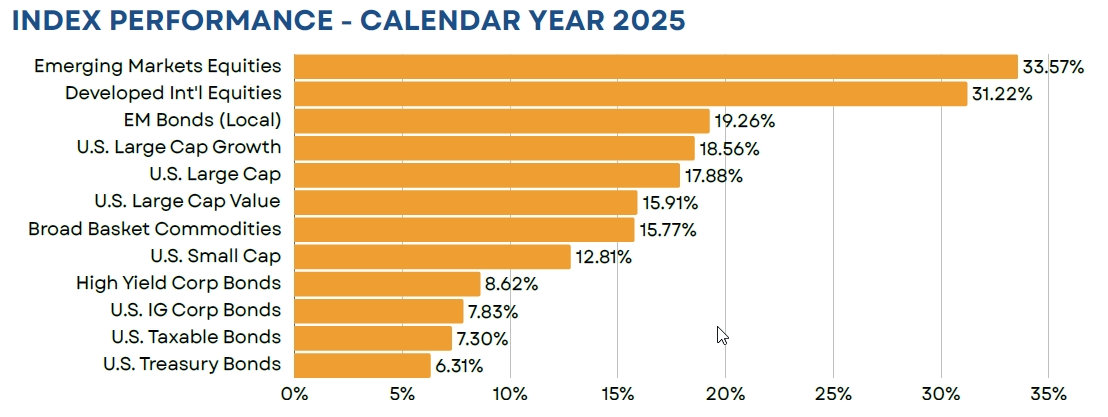
Global equity markets shook off early tariff-related fears to end 2025 with exceptionally strong returns. U.S. stocks rallied roughly 40% from their early April lows to end the year with a near 18% total return. Gains were even stronger overseas, where a significantly weaker dollar led to gains of more than 40% for non-U.S. value stocks and more than 33% for emerging markets. Investment grade bonds also had a strong year, gaining 7.30%. Returns were supported by an attractive yield environment, as bond prices rose while interest rates fell across the yield curve. Commodities trailed global equity markets but produced strong absolute returns (+15.77%). Energy prices declined while prices for precious metals soared to record highs.
Equity
Although equity market performance was generally strong in 2025, we continued to see traits of an overly concentrated and highly valued market. Of the S&P 500’s constituents, nearly 40% actually finished the year in negative territory, while the index’s eight largest names accounted for roughly half of its total return. From a valuation standpoint, these eight names ended the year trading at an average TTM P/E ratio of 70x, compared to a 27x P/E for the broad index and a 50-year average of 20x.
Gains were even more impressive overseas, where non-U.S. developed stocks advanced by 42.25% and emerging markets stocks gained 33.57% (both in U.S. dollar terms). Unlike their U.S. counterparts, gains were generally widespread, with roughly 75% of names ending the year in positive territory. Non-U.S. stocks benefitted from a number of fundamental tailwinds last year, including newly announced fiscal stimulus plans, improving economics, and a weaker dollar. They also entered the year trading at a significant valuation discount to their U.S. peers and, despite such strong returns, non-U.S. value stocks are still trading at a TTM P/E of just 14x, while emerging value stocks trade at just 13x last year’s earnings.
Fixed Income
U.S. investment grade bonds produced a total return of 7.30% in 2025, their strongest showing since 2020. Rates declined across the yield curve, as headline CPI fell to a low of 2.3% in early Q2 and the Fed continued along its rate cut campaign, although their pace was a bit slower than some anticipated. This resulted in a sharply steeper yield curve, which entered 2025 with a slope of just 32 bps between the 2- and 10-year notes, only to end the year near 70 bps (its steepest level since early 2022). From a sector standpoint, high yield bonds rose by 8.62%, as spreads ended the year near some of their tightest levels on record, just 268 bps over treasuries. Emerging markets local bonds, however, were the standout performer of 2025. Thanks to a combination of attractive yields, declining rates, and a weaker dollar, the asset class rewarded investors with a return of 19.26%. This marks its strongest calendar year return since the post-financial crisis recovery of 2009.
Real Assets
Broad-basket commodities produced attractive absolute returns (+15.77%) in 2025, trailing U.S. large cap stocks by just over 2%. Returns were largely supported by unprecedented price gains in precious metals, with gold rising by more than 60% and silver prices soaring nearly 140%. 2025 was essentially a perfect storm for precious metals investors, as geopolitical uncertainty, central bank buying, and a supply/demand imbalance sent gold and silver prices to record highs. Conversely, energy investors saw losses across most major commodity contracts, with supply concerns and falling demand weighing on prices. This resulted in a price decline of roughly 8% for crude oil and a near 24% decline in the price for natural gas.
Closed End Funds
Closed end funds saw modest discount narrowing throughout the year, with the S-Network Composite index gaining 19%. However, the environment was vastly different as we look across asset classes. International equity and municipal funds performed particularly well. International equity funds saw discounts narrow by nearly 5%, thanks to a combination of strong NAV returns and a weaker dollar, while municipal fund discounts narrowed by 3%, as the risk of increasing rates within the U.S. diminished. On the contrary, taxable bond funds which entered the year with an average discount of just 2%, traded at a 4.5% discount at year end. Although spreads declined throughout the period, discount widening was likely the result of increasing concerns around underlying credit quality as well as sector rotation from richly valued taxable bonds to more attractively valued and interest rate sensitive municipal funds.
iCM Tactical Strategies
iCM’s tactical strategies, which utilize ETFs and/or mutual funds, performed well on both an absolute and relative basis. Our fixed income strategy benefitted from an out-of-benchmark position in emerging markets bonds, while our equity portfolio was supported by an overweight to non-U.S. developed and emerging markets value stocks.
Disclosures
Integrated Capital Management, Inc. is an SEC Registered Investment Advisor. Registration does not imply any certain level of skill or training. Monthly “Market Flash” is intended solely to report on various investment views held by Integrated Capital Management. Opinions, estimates, forecasts, and statements of financial market trends that are based on current market conditions constitute our judgment and are subject to change without notice. We believe the information provided here is reliable but should not be assumed to be accurate or complete. References to specific securities, asset classes and financial markets are for illustrative purposes only and do not constitute a solicitation, offer or recommendation to purchase or sell a security. Past performance is no guarantee of future results. Please note that investments in foreign markets are subject to special currency, political, and economic risks. Index performance returns do not reflect any management fees, transaction costs or expenses. Indexes are unmanaged and one cannot invest directly in an index. Asset Allocation Outlook is intended solely to report on various investment views held by Integrated Capital Management. Opinions, estimates, forecasts, and statements of financial market trends that are based on current market conditions constitute our judgment and are subject to change without notice. We believe the information provided here is reliable but should not be assumed to be accurate or complete. References to specific securities, asset classes and financial markets are for illustrative purposes only and do not constitute a solicitation, offer or recommendation to purchase or sell a security. Outlook may change at any time given shifting market conditions. Past performance is no guarantee of future results. Please note that investments in foreign markets are subject to special currency, political, and economic risks. Index performance returns do not reflect any management fees, transaction costs or expenses. Indexes are unmanaged and one cannot invest directly in an index. Closed end funds are exchange traded, may trade at a discount to their net asset values and may deploy leverage. When the strategy purchases shares of a closed-end fund at a discount to its net asset value, there can be no assurance that the discount will decrease and may possibly increase. If a closed-end fund uses leverage, increases and decreases in the value of its share price may be magnified. Distributions by a closed-end fund may include a return of capital, which would reduce the fund’s net asset value and its earnings capacity. Closed end funds are offered by prospectus. The prospectus and/or other applicable offering documents contain this and other important information about the investment strategy. You should read the prospectus and/or other applicable offering documents carefully before investing. Investors should consider the investment objectives, risks, charges and expenses of the investment strategy before investing. iCM uses third-party data that is believed to be accurate and complete. All data is subject to change. All investing involves the assumption of risk and the possible loss of principal. The main risks as it pertains to iCM’s strategies are US equity risk, international equity and fixed-income market risk, interest rate risk and currency risk. While attempting to achieve the objectives of the strategies, investors will be exposed to the risk of loss from these sources along with others yet to be identified.
TICE Blended Benchmark comprised of 32% S&P 500/8% MSCI EAFE/38% Bloomberg Aggregate Bond/20% Bloomberg Municipal Bond/2% Cash
FTSE NAREIT All Equity REITs TR = U.S. REITs
S&P 500 Index = U.S. Large Cap
Russell 1000 Growth TR = U.S. Large Growth
Russell 1000 Value TR = U.S. Large Value
Russell 2000 Index = U.S. Small Cap
MSCI EAFE ND USD = Developed International Equities
Bloomberg High Yield Corp Bond = High Yield Bonds
Bloomberg Municipal TR = Municipal Bonds; BBgBarc
Bloomberg US Credit TR = U.S. IG Corp Bonds
Bloomberg Aggregate Bond = U.S. Taxable Bonds
Bloomberg Treasury TR = U.S. Treasury Bonds
MSCI Emerging Markets ND USD = Emerging Markets Equities;
JPM GBI EM Glbl Divers TR = EM Bonds
Bloomberg Commodity TR USD = Broad Basket Commodities
First Trust Composite Closed-End Fund TR Index = Closed End Funds
(MMXXVI)