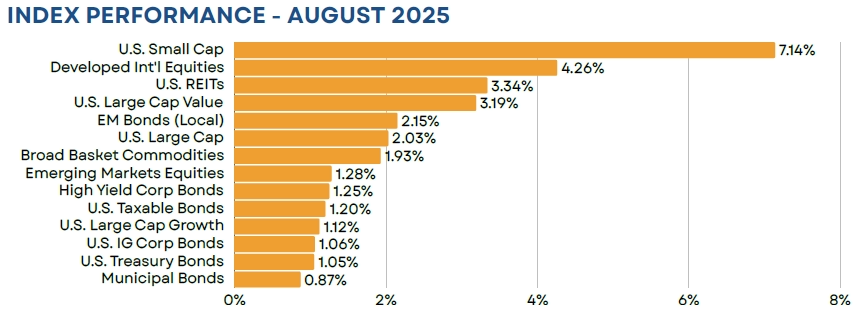
Equity markets continued their march higher in August, supported by a strong Q2 earnings season and increasing optimism around looming rate cuts. This led the S&P 500 to gains of just over 2% for the month and 10.79% on a year-to-date basis. Non-U.S. equities also performed well, with the MSCI Emerging Markets index gaining 1.28% and the MSCI EAFE index advancing by 4.26%. Developed non-U.S. stocks continued to benefit from weakness in the dollar, which contributed more than 2% to returns for dollar-based investors. Investment grade bonds gained 1.20%, as rates fell across the yield curve, while broad-basket commodity performance (+1.93%) was buoyed by price gains in precious metals.
Equity
The S&P 500 experienced a monthly gain of 2.03%, marking its fourth consecutive positive month. Investors cheered a better-than-expected earnings season, although the earnings bar was set relatively low for the quarter. From a market cap perspective, small caps were a standout performer on the month, advancing by 7.14%. The rally was largely fueled by a somewhat dovish shift in Fed language, as small caps tend to be more economically and interest rate sensitive than their large cap peers
Non-U.S. stocks continued to perform well, especially in U.S. dollar terms. Developed markets equities rose 4.26%, as European economic data continued to prove resilient. The asset class also saw a more than 2% boost from a weaker dollar, which slid on underwhelming U.S. labor market data and the prospect of interest rate cuts starting in September. Strong performance out of China led emerging markets stocks higher by 1.28%. Chinese equities benefited, as U.S. and Chinese officials agreed to extend their trade truce an additional 90 days, which is now set to expire on November 10th.
Fixed Income
Investment grade bonds gained 1.20% on the month and are now higher by just under 5% on a YTD basis. Rates fell across the yield curve as disappointing non-farm payrolls data and a dovish speech from Fed Chairman Jerome Powell in Jackson Hole greatly increased the probability of a September rate cut. High yield bonds performed generally in line with the investment grade benchmark, gaining 1.25%, while emerging markets local bonds advanced by 2.15%. With that gain, emerging markets local bonds are now higher by 13.82% on a year-to-date basis. Similar to their equity counterparts, we can attribute a good portion of that return to significant weakening in the USD.
Real Assets
Commodities performed well on the month, generally keeping pace with U.S. equities. Returns were supported by price gains in precious and base metals. Gold, in particular, ended the month at an all time high of $3447/troy oz. Prices rallied on the prospect of looming rate cuts as well as continued weakness in the U.S. dollar. Conversely, crude oil, one of the index’s largest components, saw prices fall in August, largely due to mounting supply and the coming unwind of OPEC production cuts.
Closed End Funds
Closed end fund discounts narrowed on the month, leaving the average fund trading at a discount to NAV of 3.3%. This compares to a long-term average discount of just over 4.5%. Strong equity market returns and declining interest rates led discounts lower across all major asset classes. On the fixed income side of the market, we now see taxable bond funds trading at particularly rich valuations of 1.0% below NAV, while opportunities still exist within municipal bond funds. At month end, the average municipal fund traded at a discount of 4.6% below NAV compared to a historical average of roughly 4%. Munis are the only asset class currently trading at valuations that are wider than their long-term average.
iCM Tactical Strategies
iCM’s tactical strategies, which utilize ETFs and/or mutual funds, performed well on an absolute and relative basis on the month. Our equity strategy was supported by an overweight to developed non-U.S. equities, as well as U.S. value stocks, while our fixed income strategy benefitted from an out of benchmark position in emerging markets local bonds.
Disclosures
Integrated Capital Management, Inc. is an SEC Registered Investment Advisor. Registration does not imply any certain level of skill or training. Monthly “Market Flash” is intended solely to report on various investment views held by Integrated Capital Management. Opinions, estimates, forecasts, and statements of financial market trends that are based on current market conditions constitute our judgment and are subject to change without notice. We believe the information provided here is reliable but should not be assumed to be accurate or complete. References to specific securities, asset classes and financial markets are for illustrative purposes only and do not constitute a solicitation, offer or recommendation to purchase or sell a security.
Past performance is no guarantee of future results. Please note that investments in foreign markets are subject to special currency, political, and economic risks. Index performance returns do not reflect any management fees, transaction costs or expenses. Indexes are unmanaged and one cannot invest directly in an index.
Asset Allocation Outlook is intended solely to report on various investment views held by Integrated Capital Management. Opinions, estimates, forecasts, and statements of financial market trends that are based on current market conditions constitute our judgment and are subject to change without notice. We believe the information provided here is reliable but should not be assumed to be accurate or complete. References to specific securities, asset classes and financial markets are for illustrative purposes only and do not constitute a solicitation, offer or recommendation to purchase or sell a security. Outlook may change at any time given shifting market conditions. Past performance is no guarantee of future results. Please note that investments in foreign markets are subject to special currency, political, and economic risks. Index performance returns do not reflect any management fees, transaction costs or expenses. Indexes are unmanaged and one cannot invest directly in an index.
Closed end funds are exchange traded, may trade at a discount to their net asset values and may deploy leverage. When the strategy purchases shares of a closed-end fund at a discount to its net asset value, there can be no assurance that the discount will decrease and may possibly increase. If a closed-end fund uses leverage, increases and decreases in the value of its share price may be magnified. Distributions by a closed-end fund may include a return of capital, which would reduce the fund’s net asset value and its earnings capacity. Closed end funds are offered by prospectus. The prospectus and/or other applicable offering documents contain this and other important information about the investment strategy. You should read the prospectus and/or other applicable offering documents carefully before investing. Investors should consider the investment objectives, risks, charges and expenses of the investment strategy before investing. iCM uses third-party data that is believed to be accurate and complete. All data is subject to change.
All investing involves the assumption of risk and the possible loss of principal. The main risks as it pertains to iCM’s strategies are US equity risk, international equity and fixed-income market risk, interest rate risk and currency risk. While attempting to achieve the objectives of the strategies, investors will be exposed to the risk of loss from these sources along with others yet to be identified.
TICE Blended Benchmark comprised of 32% S&P 500/8% MSCI EAFE/38% Bloomberg Aggregate Bond/20% Bloomberg Municipal Bond/2% Cash
FTSE NAREIT All Equity REITs TR = U.S. REITs
S&P 500 Index = U.S. Large Cap
Russell 1000 Growth TR = U.S. Large Growth
Russell 1000 Value TR = U.S. Large Value
Russell 2000 Index = U.S. Small Cap
MSCI EAFE ND USD = Developed International Equities
Bloomberg High Yield Corp Bond = High Yield Bonds
Bloomberg Municipal TR = Municipal Bonds; BBgBarc
Bloomberg US Credit TR = U.S. IG Corp Bonds
Bloomberg Aggregate Bond = U.S. Taxable Bonds
Bloomberg Treasury TR = U.S. Treasury Bonds
MSCI Emerging Markets ND USD = Emerging Markets Equities;
JPM GBI EM Glbl Divers TR = EM Bonds;
Bloomberg Commodity TR USD = Broad Basket Commodities
First Trust Composite Closed-End Fund TR Index = Closed End Funds
(MMXXV-II)