Executive Summary
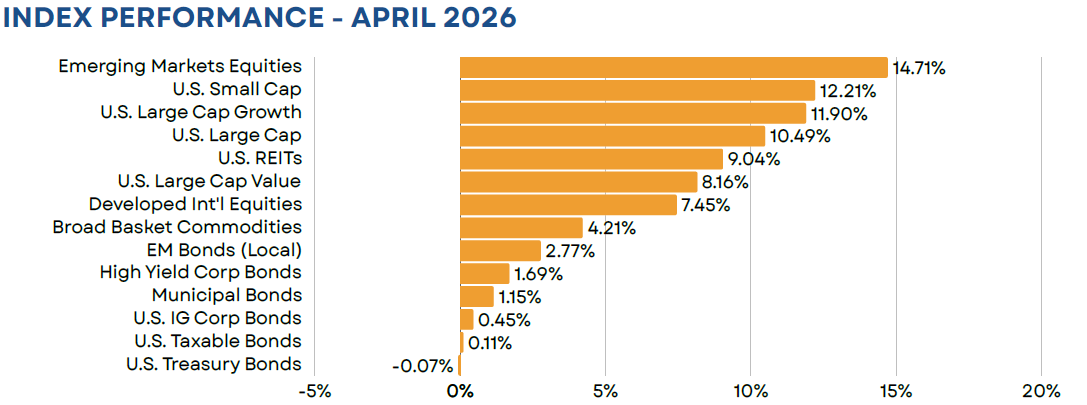
Despite little resolution in the Middle East, global equity markets rocketed to fresh all-time highs in April. The S&P 500 erased earlier losses, soaring by more than 10%, while emerging markets stocks advanced by nearly 15%. Gains were supported by improving optimism around the AI-trade as well as a solid start to Q1 earnings season. U.S. investment grade bonds saw essentially flat returns, as higher energy prices led to concerns over near-term inflation and, subsequently, pressured yields upward. This trend of higher energy prices continued to provide a tailwind to broad-basket commodities, leading to a monthly gain of 4.21% for the Bloomberg Commodity index and a YTD return of nearly 30%.
Equity
April’s gains were broad-based across geography, market cap, and style. However, growth names and, in particular, those tied to the artificial intelligence trade experienced disproportionately strong returns. This translated into positive returns for all but two of the S&P 500’s major sectors, with technology (+17.47%) and communication services (+18.54%) names leading the way. While this helped to erase earlier losses, the Russell 1000 Growth index ended the month with a YTD return of just 0.96%. Despite lagging on the month, value stocks and small caps remain clear leaders for the year with gains of 10.43% and 13.21%, respectively.
Outside of the U.S., we saw a similar trend. Returns were strong across both developed and emerging markets. However, those economies with the greatest degree of AI exposure saw the strongest gains. Most notable was Korea, where stocks soared by more than 38%. This effectively washed out the 25% decline experienced the month prior and left the MSCI Korea index higher by more than 60% for the year.
Fixed Income
U.S. investment grade bonds ended the month with a marginal gain of 0.11%, while treasuries finished in slightly negative territory (-0.07%). Yields rose in a near parallel fashion across the majority of the curve, as investors continued to price in concerns over rising near-term inflation and the possibility that rate cuts may be off the table for the remainder of 2026.
Stepping outside of the Bloomberg Aggregate index, high yield bonds and emerging local currency bonds were stand-out performers. High yield bonds gained 1.69%, buoyed by strong equity market performance and tightening credit spreads. In total, spreads collapsed by 50 bps on the month, ending April at just 271 bps over treasuries versus a 20-year average of roughly 480 bps. EM local bonds saw even stronger gains (+2.77%), with more than half of their total return coming from a reversal in emerging currencies versus the dollar.
Real Assets
Broad-basket commodities continued to march higher in April, gaining 4.21%, and are now higher by 29.65% for the year. Crude oil was once again a key contributor, although prices were highly volatile during the month. As recently as mid-April, WTI traded at a low of $83/barrel, only to close out the month at $105/barrel. Looking ahead, however, futures markets are pricing in a substantial decline from current levels, which likely reflects optimism around an end to the U.S./Iran conflict. At present, the futures curve for WTI crude exhibits a steep downward slope (i.e. it is in a state of backwardation) with the December 2026 contract trading at $80 per barrel.
Closed End Funds
Along with all risk assets, closed end funds saw a strong snapback in April. However, the majority of returns for the index were driven by NAV returns, rather than discount narrowing. At a universe level the average fund saw its discount narrow by just 15 bps, while municipal bonds discounts actually widened by approximately 30 bps. In the case of municipals, this reaction was likely due to interest rate volatility experienced during the month, with the yield on the 10- and 30-year treasury increasing by 5 bps.
iCM Strategy Performance
iCM’s Tactical strategies, which utilize ETFs and/or mutual funds, performed well on an absolute basis, but generally trailed their benchmarks in April. Our exposure to emerging markets stocks was a contributor, while overweights to commodities, non-U.S. developed stocks, and U.S. value stocks detracted from relative returns. That said, April’s detractors have been key contributors on a YTD basis, leading to substantial excess returns for our equity strategy.
iCM’s Tactical Income strategies, which include TICE and TAO, also performed well on an absolute basis. However, relative results were mixed. Our fixed income strategy performed well due to an allocation to emerging markets local bonds, while our equity strategy slightly underperformed due to positions in non-U.S. value stocks and commodities. Year-to-date all strategies remain well ahead of their respective benchmarks.
Disclosures
Integrated Capital Management, Inc. is an SEC Registered Investment Advisor. Registration does not imply any certain level of skill or training. Monthly “Market Flash” is intended solely to report on various investment views held by Integrated Capital Management. Opinions, estimates, forecasts, and statements of financial market trends that are based on current market conditions constitute our judgment and are subject to change without notice. We believe the information provided here is reliable but should not be assumed to be accurate or complete. References to specific securities, asset classes and financial markets are for illustrative purposes only and do not constitute a solicitation, offer or recommendation to purchase or sell a security.
Past performance is no guarantee of future results. Please note that investments in foreign markets are subject to special currency, political, and economic risks. Index performance returns do not reflect any management fees, transaction costs or expenses. Indexes are unmanaged and one cannot invest directly in an index.
Asset Allocation Outlook is intended solely to report on various investment views held by Integrated Capital Management. Opinions, estimates, forecasts, and statements of financial market trends that are based on current market conditions constitute our judgment and are subject to change without notice. We believe the information provided here is reliable but should not be assumed to be accurate or complete. References to specific securities, asset classes and financial markets are for illustrative purposes only and do not constitute a solicitation, offer or recommendation to purchase or sell a security. Outlook may change at any time given shifting market conditions. Past performance is no guarantee of future results. Please note that investments in foreign markets are subject to special currency, political, and economic risks. Index performance returns do not reflect any management fees, transaction costs or expenses. Indexes are unmanaged and one cannot invest directly in an index
Closed end funds are exchange traded, may trade at a discount to their net asset values and may deploy leverage. When the strategy purchases shares of a closed-end fund at a discount to its net asset value, there can be no assurance that the discount will decrease and may possibly increase. If a closed-end fund uses leverage, increases and decreases in the value of its share price may be magnified. Distributions by a closed-end fund may include a return of capital, which would reduce the fund’s net asset value and its earnings capacity. Closed end funds are offered by prospectus. The prospectus and/or other applicable offering documents contain this and other important information about the investment strategy. You should read the prospectus and/or other applicable offering documents carefully before investing. Investors should consider the investment objectives, risks, charges and expenses of the investment strategy before investing. iCM uses third-party data that is believed to be accurate and complete. All data is subject to change.
All investing involves the assumption of risk and the possible loss of principal. The main risks as it pertains to iCM’s strategies are US equity risk, international equity and fixed-income market risk, interest rate risk and currency risk. While attempting to achieve the objectives of the strategies, investors will be exposed to the risk of loss from these sources along with others yet to be identified.
TICE Blended Benchmark comprised of 32% S&P 500/8% MSCI EAFE/38% Bloomberg Aggregate Bond/20% Bloomberg Municipal Bond/2% Cash
iCM TICE Alpha Opportunities Benchmarks:
TAO 35/65‐Blended Index: 26.25% Russell 3000/8.75% MSCI EAFE/63% Bloomberg Aggregate Bond/2% Cash
TAO 50/50‐Blended Index: 37.5% Russell 3000/12.5% MSCI EAFE/48% Bloomberg Aggregate Bond/2% Cash
TAO 60/40‐Blended Index: 45% Russell 3000/15% MSCI EAFE/38% Bloomberg Aggregate Bond/2% Cash
TAO 80/20‐Blended Index: 60% Russell 3000/20% MSCI EAFE/18% Bloomberg Aggregate Bond/2% Cash
iCM Income Opportunities Benchmark: Blended Index: 7.50% Russell 3000/2.50% MSCI EAFE/88% Bloomberg Aggregate Bond/2% Cash
Index Definitions:
FTSE NAREIT All Equity REITs TR = U.S. REITs
S&P 500 Index = U.S. Large Cap
Russell 1000 Growth TR = U.S. Large Growth
Russell 1000 Value TR = U.S. Large Value
Russell 2000 Index = U.S. Small Cap
MSCI EAFE ND USD = Developed International Equities
Bloomberg High Yield Corp Bond = High Yield Bonds
Bloomberg Municipal TR = Municipal Bonds; BBgBarc
Bloomberg US Credit TR = U.S. IG Corp Bonds
Bloomberg Aggregate Bond = U.S. Taxable Bonds
Bloomberg Treasury TR = U.S. Treasury Bonds
MSCI Emerging Markets ND USD = Emerging Markets Equities;
JPM GBI EM Glbl Divers TR = EM Bonds;
Bloomberg Commodity TR USD = Broad Basket Commodities
First Trust Composite Closed-End Fund TR Index = Closed End Funds
(MMXXVI)